
Request a walkthrough
The investigation workspace for SNOW
A finding is a starting point. SNOWboard brings process activity, detections, connections and host context together so analysts can work through what happened and decide what to examine next.
Move between an investigation, its Timeline, the process tree and the host’s event stream. Follow the evidence into network relationships and outside-address context, then prepare the next authorized step.
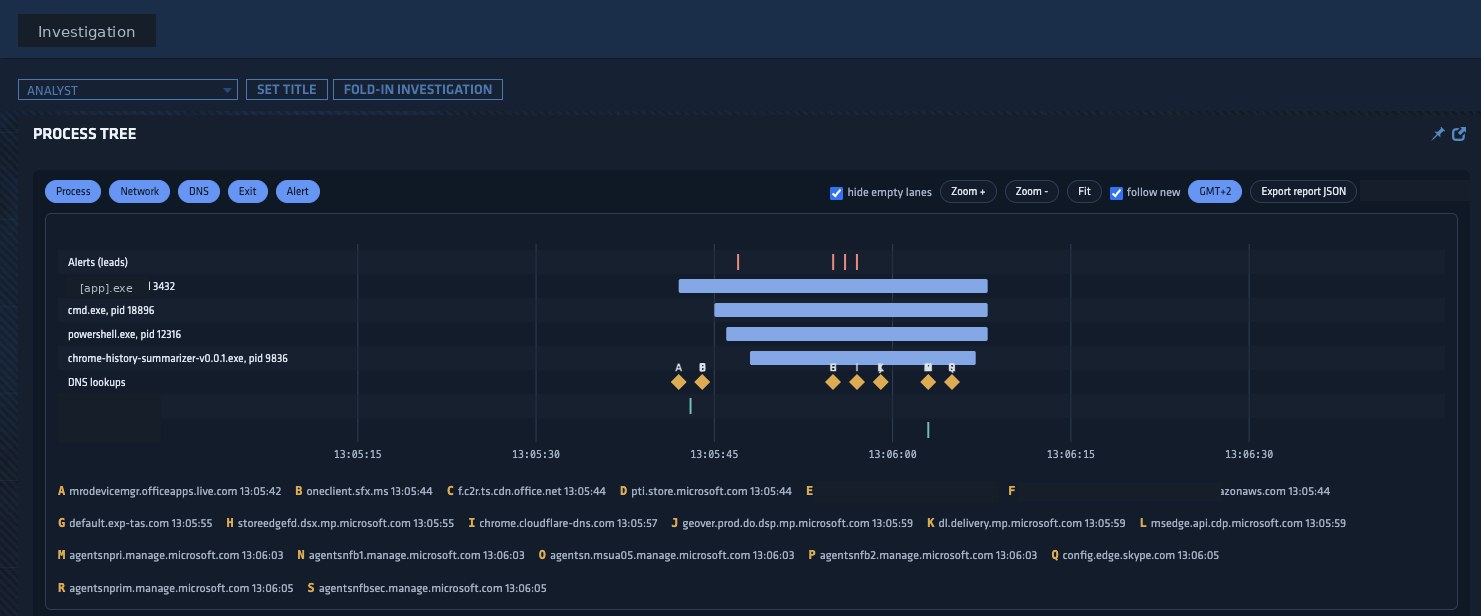
Anonymized October 2026 process-tree timing example, not a current fleet view. Select the image to view it full-size.
Open full-size investigation example (opens in a new tab)
Available views and records depend on your role, the enrolled endpoints and the telemetry retained for your deployment.
Put the process chain, detections and supporting host activity in time order. Use the Process Tree and Timeline as complementary views of the investigation.
Events around a finding help you inspect what preceded it and what followed. Links into the host event stream provide a wider window when the immediate process chain is not enough.
Review the leads grouped into an investigation, the affected hosts and the evidence behind each finding. Move from a lead to its recorded event instead of relying on a label alone.
A new relationship, an unsigned program or a memory anomaly needs context. Investigation status records the review workflow; it does not by itself establish whether a host is compromised or clean.
Inspect process-to-process relationships across enrolled hosts, with graph and list views. Review which relationships are new, how common a pattern is and which ones led to an investigation.
Program identity may come from live activity, a process snapshot or the operating system. Unknown ends remain unknown. An external address’s service record is enrichment, not proof of a remote process identity.
Review your public addresses, exposed services and remote-administration ports. Address details add service and vulnerability context from public scans; inbound views show observed connections to the covered environment.
Scan dates and confidence matter. A possible vulnerability inferred from a version number is not proof of exploitation, and a public scan does not establish which device behind a shared address owns the service.
Review host information, investigations and the recorded event stream. Check whether an endpoint is reporting and which evidence is available before drawing conclusions from an empty view.
A workstation that is offline, a missing artifact and a reviewed investigation are different states. Coverage depends on the deployed sensor, enabled collectors and retained history.
Download an investigation’s Timeline report or export selected event-stream records as JSON with a checksum. The checksum helps verify a saved copy; it does not establish the meaning or completeness of the underlying evidence.
Tailored client reporting is a separate service deliverable: findings, limits, follow-up actions and decisions that need an owner. A dashboard export and an analyst’s assessment serve different purposes.
Use the investigation to request follow-up evidence and coordinate response within the engagement’s permissions and scope.
A detection does not authorize an action by itself. Available commands, approval steps and execution depend on the deployment. Discuss the response workflow with us rather than assuming every account can isolate a host or terminate a process.
Review process ancestry, detections and the events around a lead. Compare that activity with the host’s other recorded behaviour and investigate the gaps that remain.
Connect the local process to its observed relationships with other enrolled hosts. Use address intelligence to understand an outside service without turning scan data into a claim about unseen activity.
Process ancestry and recorded events help analysts examine activity launched by supported coding agents. Review the shell or script in its host context rather than treating a familiar tool name as proof of authorization.
SNOW’s backend AI-agent module also groups observed activity into work sessions. See the current AI-tool visibility and its boundaries. This module is distinct from an LLM making decisions for an analyst; no autonomous response authority is implied.


